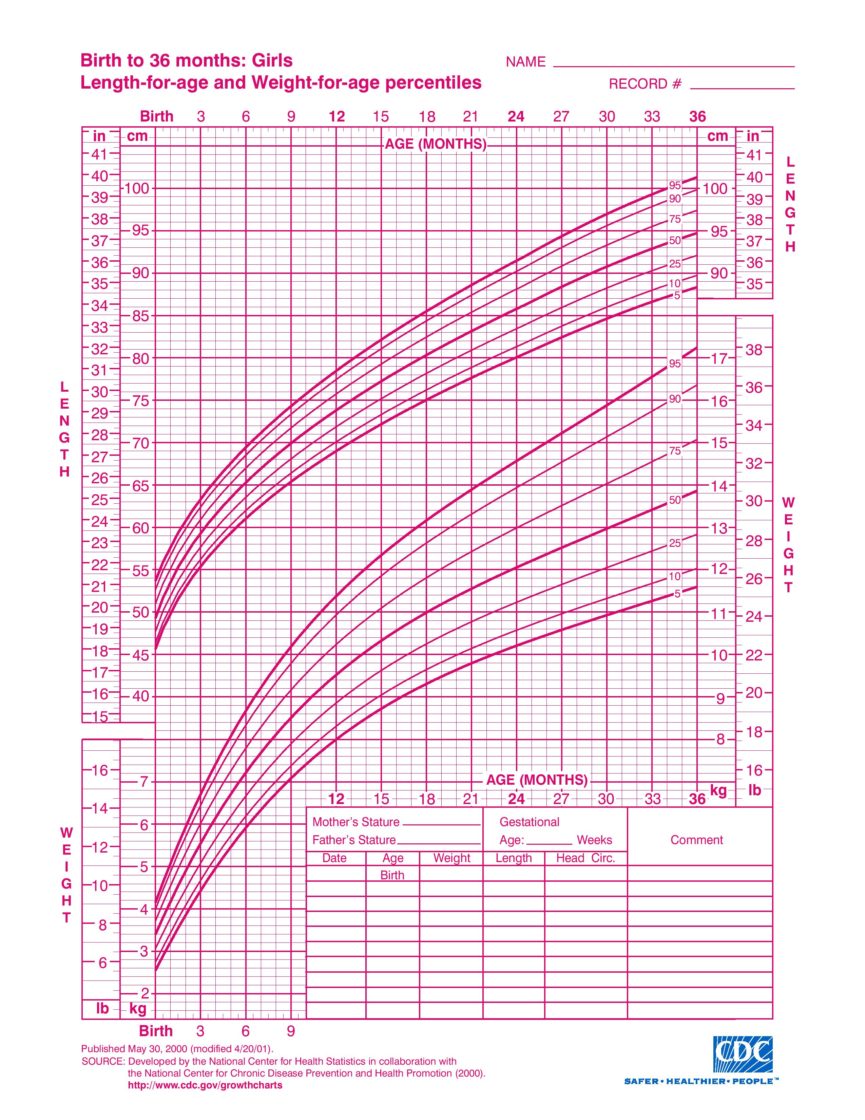
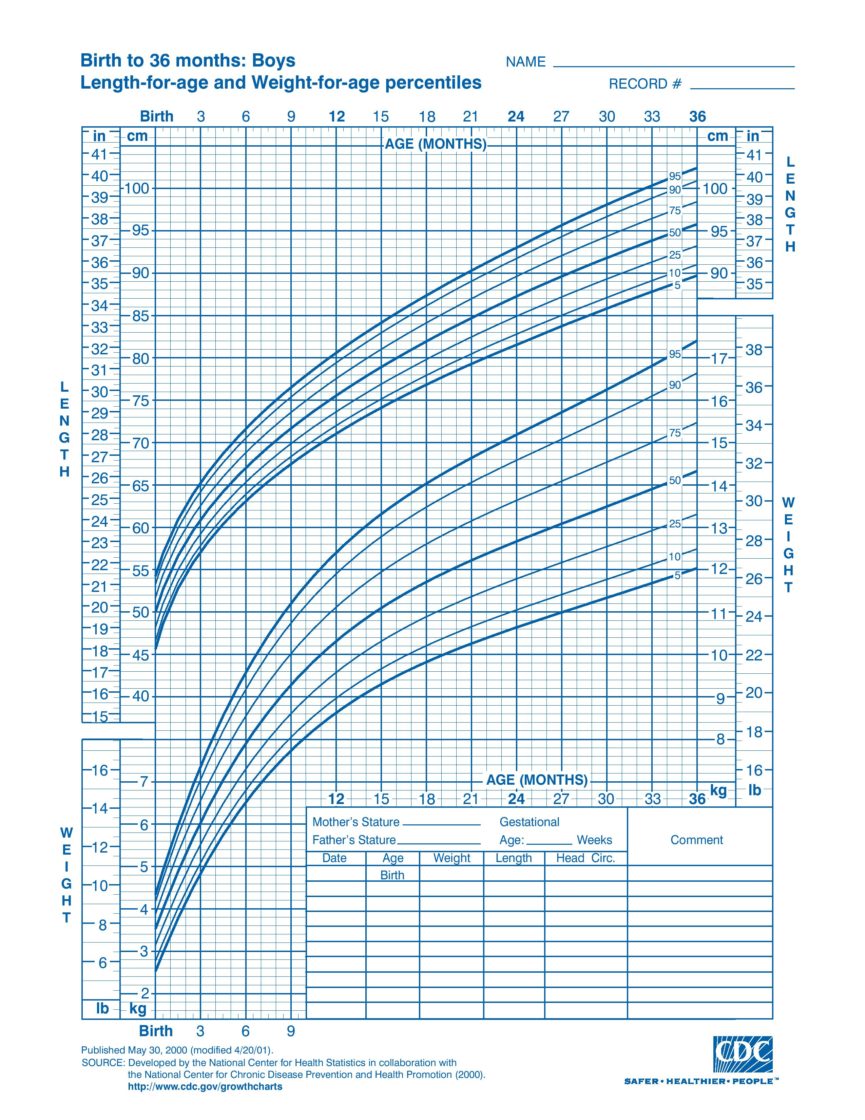
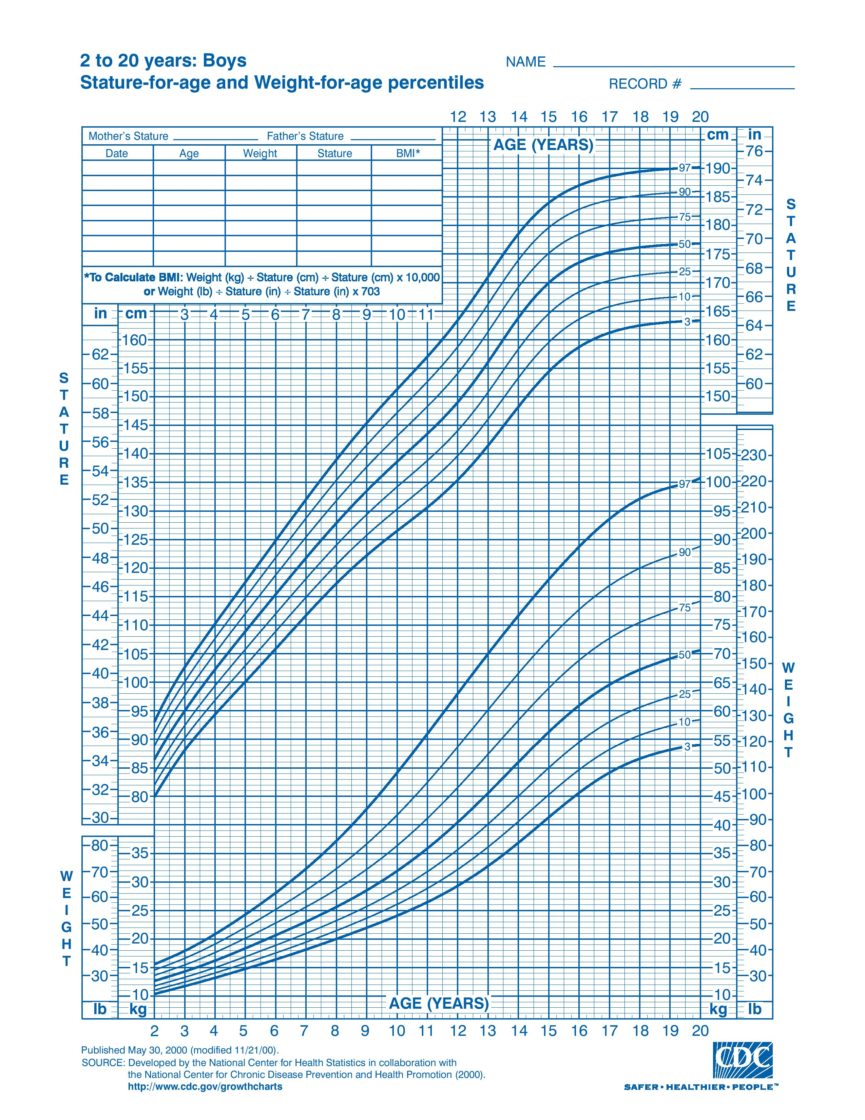
A growth chart (see bottom of page) is helpful for checking if a child’s growth is within normal limits as well as anticipating adult stature. The latter can also be done with a height calculator. To use a growth chart, locate the point where a child’s height and age intersect. The percentile of the closest curve will be the child’s approximate height percentile.
Height percentiles indicate the percentage of people that are shorter. For example, the 75th percentile indicates that 75% of people in that group are shorter while only 25% are taller. Percentiles can also be determined with a height percentile calculator.
The nice thing with a growth chart though is that you can see the entire expected growth path in one glance. A growth chart can also be printed off and a child’s height marked on it as they mature, keeping a record of growth while comparing with typical growth. It’s important to note though that an individual’s growth curve will be more jagged due to lack of averaging as well as measurement errors. Also note that height reduces over the course of the day, and so it is best to always measure at the same time of day.
A potential flaw of a growth chart is that it doesn’t work well for the highest and lowest percentiles as these typically are not plotted. And it is these that are most important to acknowledge as they may, though rarely, be due to a height related disorder.
Percentiles in general are not all that useful for extremely tall and short people. This is because fringe percentiles correspond with large variations in height. A better alternative is standard deviations (Z-score), which some height percentile calculators also include.
Growth charts and height percentile calculators use statistical averaging and thus may be misleading for the individual. For instance, ethnicity is often not accounted for. To better gauge whether height is within normal limits, it is best to consult a professional such as an endocrinologist or pediatrician.
The following growth charts were developed by Centers for Disease Control and Prevention, National Center for Health Statistics.


“It’s important to note though that an individual’s growth curve will be more jagged due to lack of averaging as well as measurement errors. To help reduce this, it helps to always measure at the same time of day.” The last sentence doesn’t make sense to me. How does measuring at the same time of day reduce measurement errors or affect someones individual growth curve over the course of months to years?
Otherwise helpful site.
Fixed. Glad you’ve found the site helpful!
We all wake up taller than what we are and lose height throughout the day, most people lose between 1.5 – 2cm from waking up to going to sleep.
One is generally a few mm taller in the morning than the evening. Therefore MoM progress could be misleading when comparing morning and evening measurements.
I’m off the chart in height how is that going to help I’m 14 and 184cm
Id say dont worry too much, a lot of my brothers and I are extremely tall and the doctors say its all okay because we are all healthy. My younger brother who is 12 (turns 13 in a few months) is about 184-186 somewhere in between there. He also isn’t on the growth chart but hes healthy and fonctions like any other normal kid other than the fact that hes taller than everyone
Rapper Machine Gun Kelly was on the 50th percentile for height when he was a child in elementary and middle school. Rapper Machine Gun Kelly had a huge growth spurt when he was a teenager in high school. Rapper Machine Gun Kelly is now on the 98th percentile for height for an adult man. Is it unusual that rapper Machine Gun Kelly went from the 50th percentile for height to the 98th percentile for height?
Personally I would say that growing that tall is pretty unusual but not very rare at the same time. I myself went from being in the 70th percentile to the 95th percentile in around 1 and a half years (Note i havent actually gone through my growth spurt yet)