Below is a height percentile calculator. It works for all ages including newborns, babies, toddlers, children, teenagers, and adults right up to the elderly. Note though that you can only specify a country when ‘Adult’ is selected. If your country isn’t listed, you can choose custom and enter your country’s average height manually into the height percentile calculator.
This height percentile calculator is only for information purposes and is not for medical purposes. There are many reasons why the results may not be relevant for any given individual. For example, percentiles for outliers may be exaggerated. Also, ethnicity is not considered. Please see the discussion below for more information on height percentile calculators.
Percentiles are used in statistics to indicate the percentage of observations that fall in a group. In the case of height percentiles, the observation is height and the group is people that are shorter. So if someone has a height percentile of 75, then 75% of the relevant population is shorter. The other 25%, of course, is taller. Besides the above calculator, percentiles can also come from growth charts.
Percentiles are useful for many purposes including recognizing when an individual is exceptionally short or tall. This affords an opportunity to look for an underlying cause, which could be a height related disorder . Specialists that can help with this include endocrinologists, pediatricians, and geneticists. Percentiles are also an alternative to height calculators for predicting adult height as percentiles will generally remain similar into adulthood. However, it is important to note that the above height percentile calculator is based on statistical averaging and there are many reasons why it may not provide relevant data for an individual. For example, it does not take into account ethnicity. It also assumes a perfectly normal height distribution, whereas human height distribution merely approximates this. This leads to error particularly for extreme short or tall stature.
The above height percentile calculator has some extras compared to most others out there. For starters, it takes into account age. Age ranges include newborn, baby, toddler, child, teenager, and adults right up to the elderly. This is important as both average height and height distribution change with age.
The height percentile calculator can also factor in country. Included countries are the U.S., Canada, most European countries, and over one hundred in total. This is important as average height varies considerably from one country to the next. Unfortunately, age specific data for all these countries is hard to come by. Hence country selection is disabled for all age selections but ‘Adult’.
All age specific data came from the Centers for Disease Control [1,2], except for ages 0 to 2, which came from the World Health Organization [3]. Note that height for ages 0 to 2 is actually measured as length.
The country specific data came from Wikipedia. For the U.S., these stats coincide with the most recent from the Centers for Disease Control [1]. Note that data for the entire adult age range was used when available. By including the elderly, average height is lowered. This is because people decrease in stature with age and older generations were shorter. If you want to calculate a height percentile for a more limited age range, you can enter other data you get from Wikipedia or elsewhere.
The height percentile calculator also lets you specify male or female gender. Some country specific data was missing one gender. To fill in the missing data, an average 8% gender height gap was used.
The population standard deviation is automatically set for you. Here, standard deviation is a measure of how spread out human height is. A larger standard deviation means a greater variation in height. The standard deviation automatically set in the height percentile calculator is approximated from Centers for Disease Control and World Health Organization data [1,2,3]. Specific countries will vary somewhat from this. If you want the most accurate height percentile assessment, you should find country specific standard deviation and enter that.
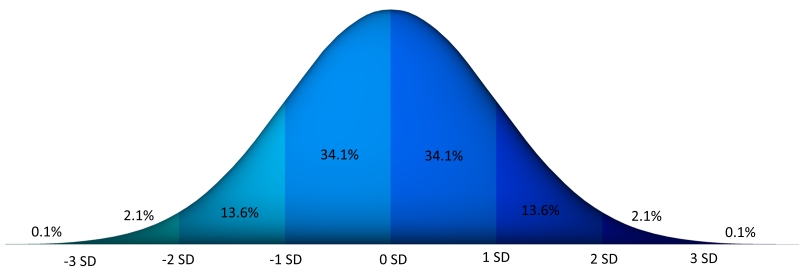
Based on this standard deviation, the height percentile calculator determines how many standard deviations (also called the standard score or Z-score) the individual’s height is from average. This can then be used to determine percentile. For example, a standard deviation of 1 corresponds with the 84.2nd percentile, 2 the 97.8th, and 3 the 99.9th. Note that as height becomes extreme, the percentile changes very little while the standard deviations from average changes linearly. Hence outliers may gain more insight from considering their standard deviations from average rather than their height percentile.
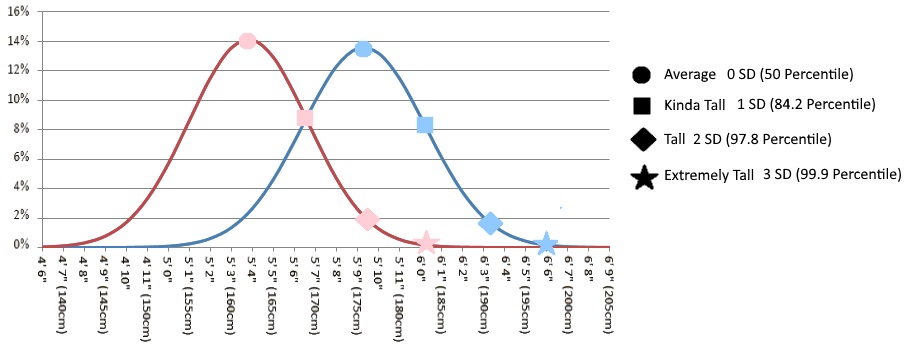
The height percentile calculator also uses the number of standard deviations from average to categorize height as in the below table. Height definitions are discussed more here: Defining Tall. Lastly, the height percentile calculator determines the number of people the individual would likely have to meet to find someone at least as short or as tall.
| SD < -3 | Extremely Short |
| -3 < SD < -2 | Short |
| -2 < SD < -1 | Kinda Short |
| -1 < SD < 0 | Below Average |
| SD = 0 | Average |
| 0 < SD < 1 | Above Average |
| 1 < SD < 2 | Kinda Tall |
| 2 < SD < 3 | Tall |
| 3 < SD | Extremely Tall |
For more height related calculators, see here: calculator. For further further reading, you might check out the books below.


[1] Anthropometric Reference Data for Children and Adults: United States, 2007–2010
[2] CDC Percentile Data Files
[3] WHO Child Growth Standards
Wow… 1 on the 898,956,303 people are taller then me. :-p
That’s under the assumption of a normal height distribution, which isn’t entirely correct. This assumption causes the most error for outliers… Nevertheless, you are rare!
@Hanno
One in 7318 people are taller than me. Working in a North American metropolitan city, I see a person as tall or taller than me about once at week when I go out to lunch.
Over the course of months spent in Chile, I saw exactly one guy as tall as me, and he was a native Chilean.
How often do you encounter a person as tall as you? I imagine in the Netherlands, for example, it would not be uncommon…
I’m guessing your city has a higher average height than the overall country average. That’s another area height percentile calculators aren’t that useful, distinguishing smaller populations. For example, at 6’7 in Canada I hardly ever see anyone taller, but go to a basketball or volleyball game and… several people making me feel short!
Calculation for “both sexes” is broken, since it tells me that 1 in 35 males are taller than me, but if I select both it tells me that 1 in 517 people is taller than me. That would make sense only if there was 10 times more women than men.
While a tall man may have some men who are still taller than him, he will have nearly zero women who are taller than him. This is because of the difference in average heights and distributions tailing for outliers. It is a bit hard to wrap your head around, I know, but the calculator is working correctly.
I don’t think so, because those ratios imply that there is roughly four million men taller than me in the US, but only half million people of both sexes taller than me.
You are right. Thanks for being persistent! That option has been disabled, hopefully there will be time to fix it at some point. The problem is that the calculator was assuming the same normal distribution for both as it was for either gender, which is not the case. Thanks for spotting this.
I came out “extremely tall” — funny, but perfect strangers tell me this all the time, so why do I need a calculator?
Like candy, height comments don’t come best from strangers.
I am taller than 99.95 %, not sure that is accurate
LOL “extremely tall”, 99.9 percentile. Sounds exaggerated, but funny 🙂
I am in the 100% percentile. 1 in about 1,145,410,928 are taller than I
And how tall is that? like 7 something?
I put 7’2
99.987! Wow
99,991% 🙂
Ha ha ha! I just entered my data. By the CDC stats, I’m above the 90%. The “calculator” puts me at above 99%! I call bullshit.
CDC says 6’2 is 95th percentile. So no surprise 6’5 is 99th percentile. Perhaps you are looking at old stats or something…. check here: http://www.cdc.gov/nchs/data/series/sr_11/sr11_252.pdf
Interesting! Are people getting statistically shorter now? When I was running the Dallas club in 2005, younger potential members just shrugged and said that all their friends would qualify for the club, so why bother joining? I guess that argument doesn’t fly anymore.
In the U.S. it does appear that way! Though only slightly. Also interesting is that female standard deviation has suddenly gotten larger.
Immigration?
My stats? I am an adult male that is 6 foot five inches tall.
99.846
ha ha 100 %
Cool I got 99.999 percentile extremely tall. I figured I might get close to that.
FYI I’m 6’10”
99.986%
99.935%
How tall..?
6’2″
99.935 is too much, don’t u think?
Seems about right to me. I would guess that at least 99% of women I meet are shorter than I am.
Well.. ok. Tall and Short are subjective terms…
99.87
99.991 Percentile
100 %.. lol.. not unexpected
How tall are you to be in the 100% percentile Ryan?
99.846%
Okay so I’m extreme, nothing new in that. Adding age to the equation would paint a different story… younger generations are getting taller and of my older generation I would be more extreme than I am calculated today. The good side of the taller young generation is the clothing choices are getting better and better for us extreme types no mater what age! 🙂 (I’m 6’6″ and age 58).
I would have guessed the same thing. But the linked CDC stats show the average man in their 50’s is 0.1″ taller than the average man in his 20’s. Very unexpected…
30 years might not be enough of a age difference for this effect, but I too am slightly surprised. I guess 100 years, or 1,000 years would show this better. I do know door openings used to be 6’0″ back in the 15th century (think castles) and today (in USA) the current building requirement is door opening must be 7’0″ minimum. Counter top heights have also gotten taller over time.
Last 150 years have seen about 4″ increase in height, guess tapering off is happening now, at least in the U.S.. Yikes, 6′ doorways!
The decrease shown by CDC is probably due to immigrants (who are disproportionately likely to be Hispanic and, therefore, disproportionately likely to be short.) Looking at the non-Hispanic white and non-Hispanic black tables shows the 20-39 male to be equal to or a bit taller than the 40-59 male. However, if you look at the overall numbers, the 20-29 group is indeed a bit down, presumably due to containing more recent immigrants than the older groups. The CDC data show the average Hispanic male to be about 3″ shorter than the average non-Hispanic white male.
I’d guess there are probably also more recent Asian immigrants in the 20-29 category than the 50-59 category, which likely also contributes to this effect. However, this almost certainly doesn’t affect the all-race average as much as the Hispanic population, since there are far more recent Hispanic immigrants than recent Asian immigrants in the U.S.
100% I’m 6’5″
99.952 Percentile
I am 6’7″
99.494% and 1 in 1 are shorter then me, but 1 in 197 are taller. Maybe I’m just not reading this right as I have had little sleep but essentially this is saying that only approximately 0.50% of the USA female population is taller then me right? I feel like this is saying the opposite…
1 in 197 are taller means you rarely see anyone taller than you, only a small percentage (0.5%) are taller. It’s working correctly.
99.98% 15 yo, 6″5 one out of nearly 5000!
Haha, for a woman in her 20s in the world: 1 in 2010 are taller than me, 99.95 percentile. For an adult woman in Australia, 1 in 5080 are taller than me, 99.98 percentile
Apparently I’m “extremely tall”…. No shit.
It’s says I’m 99.988 percentile and 1 in 8525 are taller.
Female adult in US: 98.3 percentile, 1 in 60 are taller
Female in 20’s: 97.4 percentile, 1 in 38 are taller
You ladies are “short”. I’m 1 in 150,000 standing at 6’4″
When did you stop growing?
17 or 18
Karen Leet my daughter just turned 13 and is over 6’1″
In what country?
USA
For my 13 year old daughter, 1 in 73,924 are taller.
I got 99.985 percentile at 6’1″ in Canada
99.986 percentile
99.993 percentile :O
….says I got 100 percentile. Surely I did something wrong lol.
How tall are you? Haha.
99.805 percentile. 6’6″ here but to be honest, sometimes not that picky.
Me too. Finally something I’m 99 percent in. Lol Average is 5.3? Dang! Glad I’m not average!
99.997 percentile
Extremely tall
99.988 here as well…more flying Unicorns than us tall gals;)
How tall are you?
Me too!
Oh I just copied another poster who was my height but in UK. Sorry. Lol In any case I am freaky tall anyway.
Does anyone have statistics on human height worldwide (not broken down by anything but male and female)? Obviously, in the world, some groups of people are shorter, some taller. We don’t look at a “tall” Nepalese man and call the Nepalese “short” just because he is shorter than an average Dutch man. On the other hand, I am looking to see what the statistics are of all humans, for example, the percentage of men worldwide, who are 6 feet tall or taller. The percentage of men above 6′ in the US will be entirely different than amongst native peoples in Australia, but that isn’t what I am trying to figure out. So far, all statistics I’ve seen are broken down by country, race, tribe, or other parameter.
All I want is male and female, for all humans. Does anyone know where to find that data set, or even chart?
Just go to the Wikipedia page about list of all the countries in the world in terms of population. And by visiting that site you can see that China is the populated country followed by India. So according to the population of each and every country we can find the average height of the male all over the world. I have calculated the average. Since in the top 10 countries most of the countries are from Asia. So The average height of the male is slightly shorter, it is about 5 feet 6.6 inches for male and 5 feet 1.6 inches for female. It is approximately accurate. Thank you
Akh
Interesting. I play basketball so I meet a lot of taller dudes almost everyday. It doesn’t seem like I’m in the top 0.9 percentile
Where was the standard deviation found? Why does this calculator assume normal distribution (it should be log-normal)?
Check out this article, height has been approximated by both normal and log-normal distributions: http://www.ncbi.nlm.nih.gov/pmc/articles/PMC2831262/
May have found a bug: When loading the page, default country is listed as US and Standard Deviation for men is listed as 2.94 inches. Upon switching to another country, standard deviation adjusts(almost always to 2.92 inches). When switching back to the US, standard deviation does not return to 2.94 inches, but instead remains at the second value.
That should be fixed. But in the mean time, 0.02 shouldn’t make much difference. Thanks for pointing it out.
99.979? Wow. I guess it’s because I’m not yet an adult but that seems very high!
Yeah! I’m so very lucky: 6’5″ and living in Spain…. with my Croatian girlfriend who stands 6’4″ without the heels she kindly wears always. Even bare-footed, she’s almost one-in-a-million: 1 in 470,000 or so. The heels do it though… 1 in about 80 million. I’m sold!
Hi Sam! Very nice calculator. Get this, I’m only 5 foot 10, but in Indonesia one in 153,693 women are taller than me. There are 1,626 women in Indonesia who are taller than me.
For you Sam, you’re 6 foot 7, so there are no women in Indonesia who are taller than you. In fact that’s the case millions of times over.
Hey get this. For you Sam, there’s only ONE male in Indonesia who is taller than you, and that is only by a fraction. If you were a quarter of an inch taller, there would be no-one. For all intents and purposes, the tallest male in Indonesia is your height.
Well I know there might be an abnormal case here or there, but that’s the distribution or whatever.
I grew up in a family of shorter people and I reached almost the 90th percentile at 89.6% 6’1, I never realized how short normal people are, but some of my friends make me look like Danny DeVito haha I miss using the handles in the buses instead of the bar above it because it’s at my eye level 🙁
At 6’2″ I don’t consider myself really tall, but, roughly only 1 in 20 people are taller than me. That being said, sometimes I notice I’m the tallest person in the room, yet sometimes I notice 3 or 4 people in a room of say 30, that are taller than me. The country differences are pretty cool, like I’d be the tallest out of 10,000 in Vietnam, but in Serbia, which I think is the tallest country, I’d be very close to average, as 1 in 4 would be taller than me.
I think that’s really cool that height averages are different. Does anyone know why different races are different heights? I can’t think of why we might have evolved like that.
Hi Nandini, I’m Alan from Australia and am 5’10’. About one inch above average for my country.
The reason I’m replying apart from wanting to say hello, is that I actually do have my own theory on why heights are different among different ethnicities. I think it’s could be quite valid, at least in part, and possibly even in large part. Would you like to hear it Nandini???